
The numbers behind the mountain.
Every second, the equivalent of one garbage truck of textiles is landfilled or burned somewhere in the world.1 Here is what the evidence says, and how we measure our part.
What the world throws away.
of textile waste generated every year.2
of the total fibre market comes from textile-to-textile recycling; only 8% of fibres came from recycled sources in 2023.2
of global carbon emissions come from the fashion industry.1
of water to make a typical pair of jeans.1
of annual microplastic losses to the ocean come from textiles.1
Here at home.
The EPA's most recent material-specific data (2018) shows how far we have to go.
The cost is paid before we ever buy.
of water used each year for fabric dyeing alone.4
of industrial water pollution is due to garment manufacturing.4
of greenhouse gases from polyester production for textiles in 2015, equal to 185 coal-fired power plants' annual emissions.4
clothing bought by the average consumer than in 2000, with each garment kept half as long.4
The gap we can close.
California generates 2.8 billion pounds of textile waste every year and diverts only 423 million pounds.5
It is estimated that 95% of used textiles are recyclable, yet only 15% are diverted from landfills.5
Closing that gap takes two things at once: a bigger, better collection network, and a shift in behavioral norms. GEF works on both.5
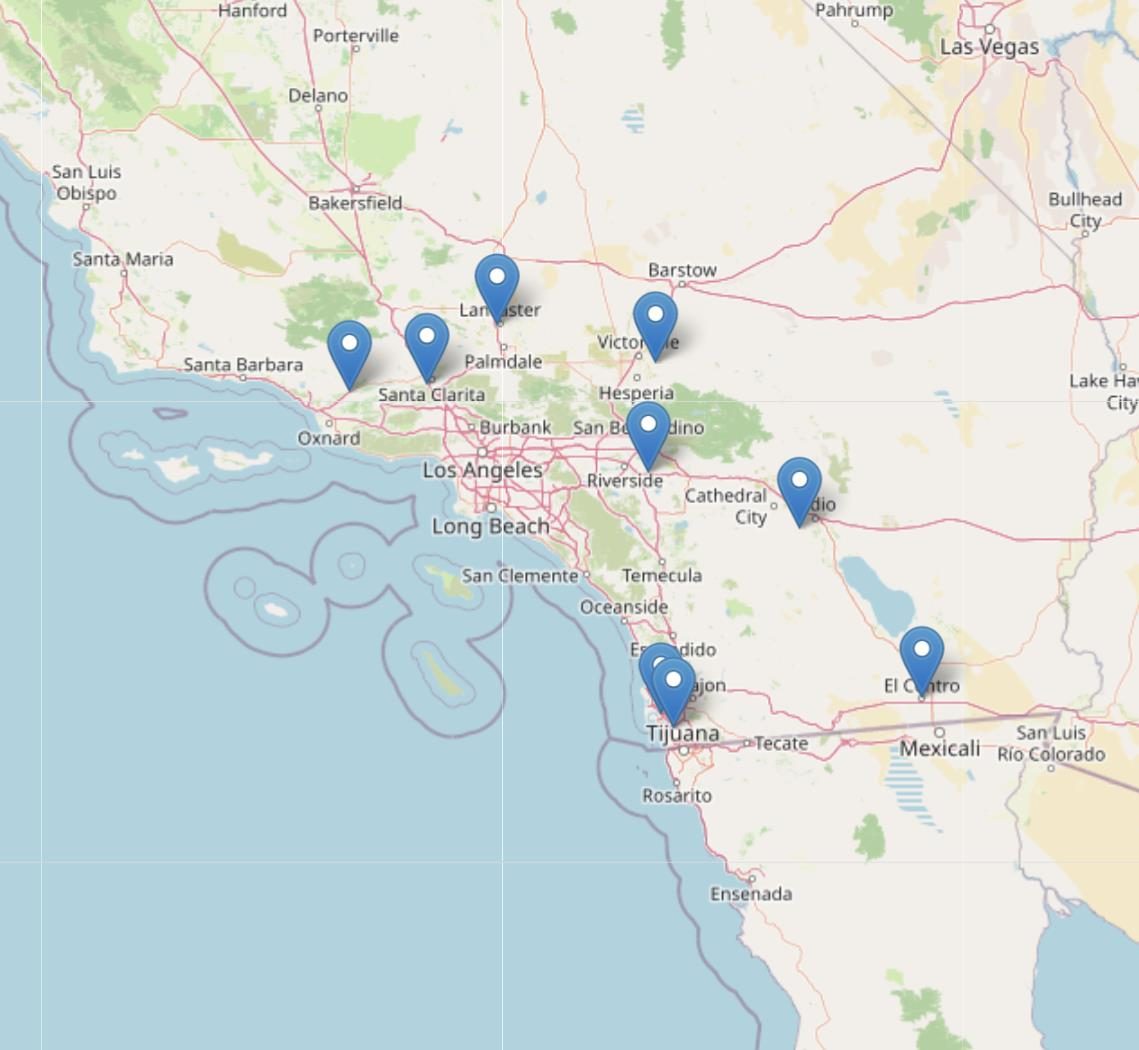
Every pound, weighed and signed for.
When a station is emptied, the contents are weighed, and both the driver and the site maintenance person sign to agree on the weight. Every weight goes into GEF's proprietary Diversion Verification Software (DVS).6
Property partners get real-time access to the diversion weights from their locations, and can print certified reports for their own sustainability statistics.6
With GEF, apparel company Azazie diverted more than 57,600 pounds of used textiles. Reusing 70% of them saved an estimated 20,000+ pounds of cotton and 48.5 million gallons of water.7
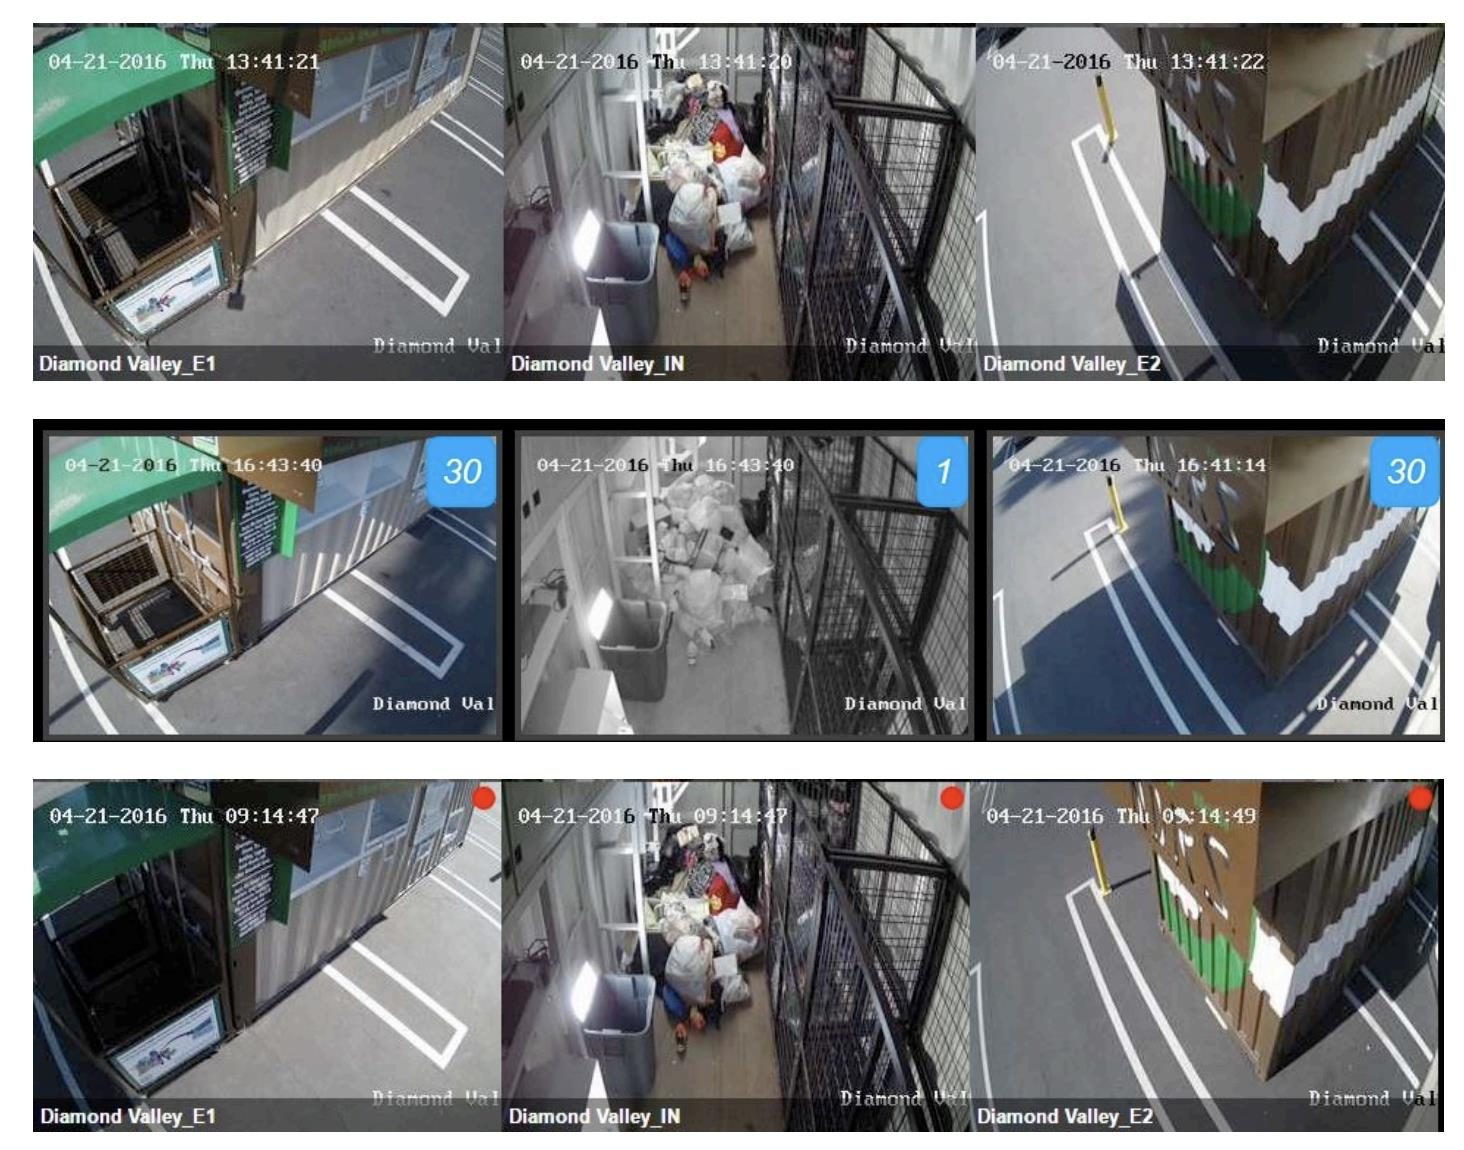
We only use figures we can source.
Some numbers about fashion get repeated so often they feel like facts, like the claim that fashion is the world's second-most-polluting industry. When a figure doesn't trace back to a credible primary source, we leave it out. Every statistic on this page links to where it came from.
Researchers, students and journalists: we're glad to talk about our data and our methods.
The numbers are big. So is what we can do together.
Fund the education that changes behavior, or put a station where your community can use it.